LATEST CONFIRMED CASES OF COVID-19 IN SOUTH AFRICA (3 April 2022)
The National Institute for Communicable Diseases (NICD), a division of the National Health Laboratory Service, continues to provide laboratory-based surveillance to inform the public health response towards COVID-19 in South Africa.
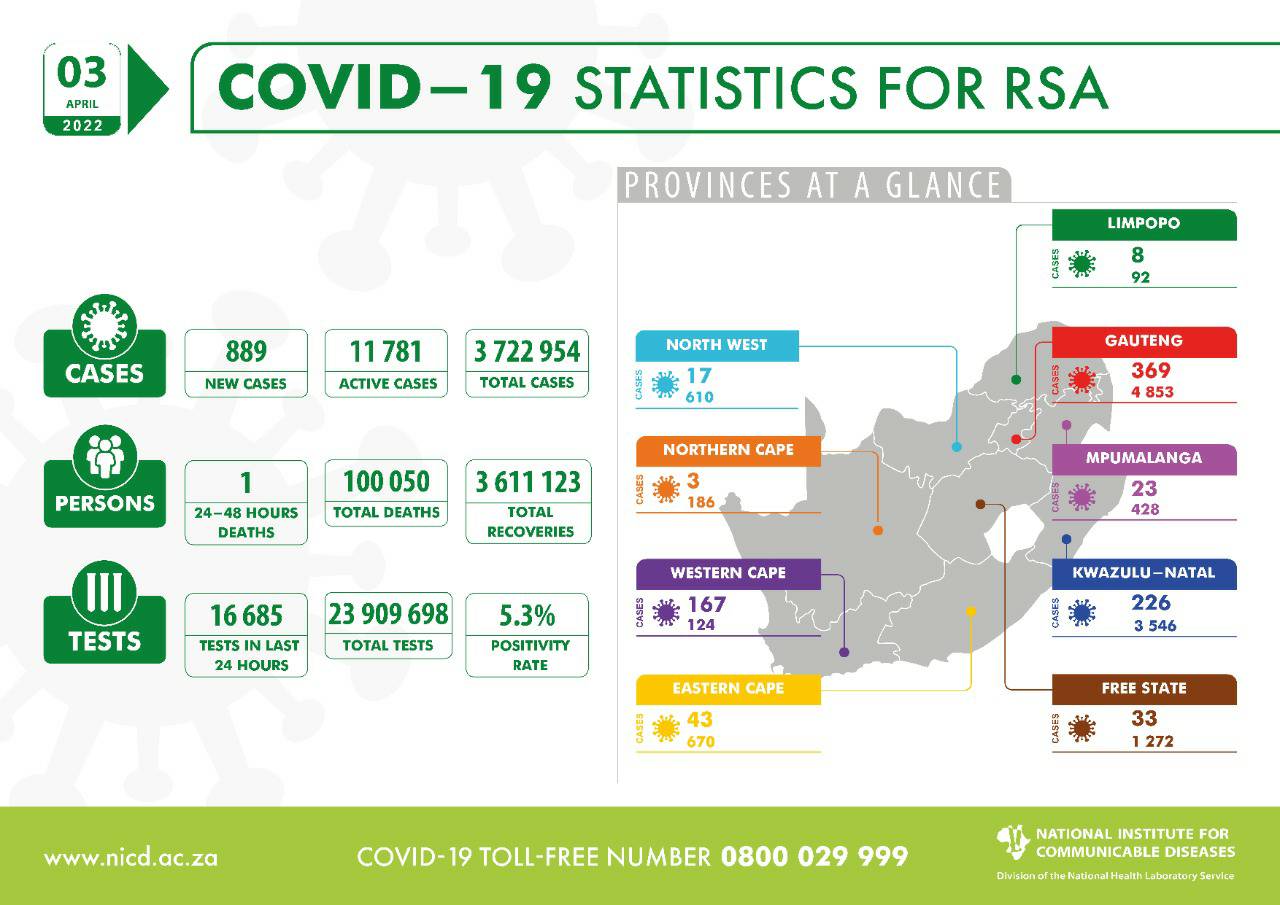
Today the institute reports 889 new COVID-19 cases that have been identified in South Africa, which brings the total number of laboratory-confirmed cases to 3,722,954. This increase represents a 5.3% positivity rate.
Due to the ongoing audit exercise by the National Department of Health (NDoH), there may be a backlog of COVID-19 mortality cases reported. Today, the NDoH reports 4 deaths and of these, 1 occurred in the past 24 – 48 hours. This brings the total fatalities to 100,050 to date.
23,909,698 tests have been conducted in both public and private sectors as per the table below.
|
Sector |
Total tested |
New tested |
||
|
Private |
12,999,476 |
54.4% |
10,569 |
63.3% |
|
Public |
10,910,222 |
45.6% |
6,116 |
36.7% |
|
Total |
23,909,698 |
100.0% |
16,685 |
100.0% |
PROVINCIAL BREAKDOWN
The majority of new cases today are from Gauteng (42%), followed by Kwa-Zulu Natal (25%). Western Cape accounted for 19%; Eastern Cape accounted for 5%; Free State accounted for 4%; Mpumalanga accounted for 3%; North West accounted for 2%; Limpopo accounted for 1%; and Northern Cape accounted for <1% of today’s new cases. The cumulative number of cases by province are shown in the table below:
|
Province |
Total cases for 2 April 2022 |
Adjusted numbers after harmonisation |
Updated total cases on 2 April 2022 |
New cases on 3 April 2022 |
Total cases for |
Percentage total |
|
Eastern Cape |
345,292 |
0 |
345,292 |
43 |
345,335 |
9.3 |
|
Free State |
202,471 |
0 |
202,471 |
33 |
202,504 |
5.4 |
|
Gauteng |
1,210,504 |
0 |
1,210,504 |
369 |
1,210,873 |
32.5 |
|
KwaZulu-Natal |
661,077 |
0 |
661,077 |
226 |
661,303 |
17.8 |
|
Limpopo |
155,873 |
0 |
155,873 |
8 |
155,881 |
4.2 |
|
Mpumalanga |
193,333 |
0 |
193,333 |
23 |
193,356 |
5.2 |
|
North West |
193,098 |
0 |
193,098 |
17 |
193,115 |
5.2 |
|
Northern Cape |
108,950 |
0 |
108,950 |
3 |
108,953 |
2.9 |
|
Western Cape |
651,467 |
0 |
651,467 |
167 |
651,634 |
17.5 |
|
Total |
3,722,065 |
0 |
3,722,065 |
889 |
3,722,954 |
100.0 |
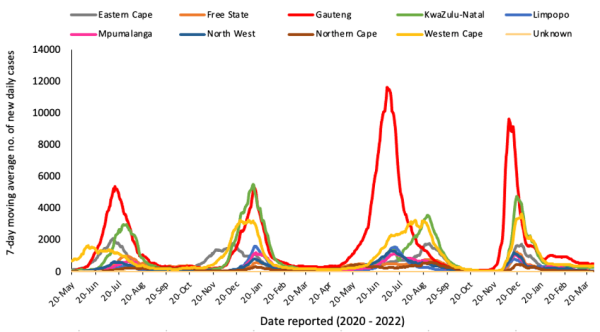
THE 7-DAY MOVING AVERAGE NUMBER OF NEW CASES BY PROVINCE
The proportion of positive new cases/total new tested today is 5.3%, and is lower than yesterday (5.4%). The 7-day average is 5.7% today, and is lower than yesterday (5.8%).
For detailed information, visit the GIS Dashboard.
HOSPITAL ADMISSIONS
There has been an increase of 4 hospital admissions in the past 24 hours. The following table is a summary of reported COVID-19 admissions by sector.
|
Sector |
Facilities Reporting |
Admissions |
Died to Date |
Currently Admitted |
|
Private |
259 |
233,049 |
39,417 |
788 |
|
Public |
407 |
279,130 |
62,188 |
1,119 |
|
TOTAL |
666 |
512,179 |
101,605 |
1,907 |
VACCINE UPDATE
For updates on the national vaccine programme, click here.
Thank you for your interest and remember that adhering to the following preventative measures helps to limit your risk of contracting and spreading COVID-19:
- Getting vaccinated for COVID-19
- Wearing your mask properly to cover your nose
- Opting to gather in ventilated spaces
- Avoid unnecessary gatherings
- Keeping a social distance of one meter or more
- Washing your hands regularly in the day with soap and water
For more information on COVID-19, click here.

